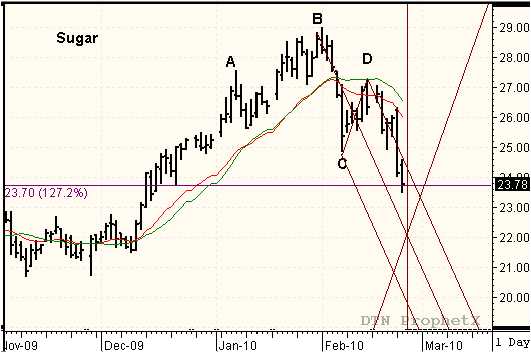
Sugar completed a bearish TR pattern after the (D) pivot high was confirmed inside the 60% sell window on February 16. (See February 17th issue of TMV Swing Trading Report) The sell signal at 26.05 was triggered the following day. The reverse/forward count projected the future reversal date for February 24 (marked on chart) with a target at 23.65. Sugar formed a new swing pattern inside the (C) to (D) reaction swing, but the two day paused ended with a large outside day on February 22. The market reached the 23.65 target objective the following day for a gain of 240 points.


John – I subscribe to TMV and have been studying your system. If you have a moment could you explain why you moved the profit target from 22.50 to 23.65. It was originally in the TMV as 22.50 and that is also where the intersection of your reversal date and reaction line are. If you could explain your logic in making the change, it would be very helpful.
Thank you.
I raised the target objective because the market had dropped so much in one day and it was still trading on the right side of the median line. Therefore, I decided to use the 127.2% Fib extention as the target price instead of waiting for the market to drop to the reaction line. While the reaction line is still in play as a downside objective, a market will typically rebound slightly or trade as an inside day after an very wide range day. I wanted to take advantage of the market action in case of a rebound. This was subjective decision based on past experience. We’ll see if it was the right decision over the next couple of days.
I see. Thank you for the explanation.
Thanks John, I also saw the video that you posted to explain why you exited sugar early but still don’t understand.
I thought that if sugar (or anything else) is in a downtrend and turns upward early– before the expected target date– that this is often a sign that the strength is building even more to the downside and the downtrend will resume even stronger. Why didn’t you therefore stay in? Why did you interpret this as the market was moving away from the mid-line upward, rather that seeing it that the market was temporarily turning upward early and would resume the trend downward even stronger?
Am I missing or misinterpreting something?
Thanks
It does appear I exited early. I set the target, based on the TR pattern and the 2/24 reversal date. Typically a market moving to the right of the median line is losing momentum, therefore I used the alternate Fib target projection. The market did rebound 72 points on the reversal date, but it also closed as an inside day. I consider an inside day as a continuation pattern so I was waiting for one more higher close to offer a new sell pattern with a new reversal date, based on the small reaction swing that formed between 2/17 to 2/19. Unfortunately, I did not get the higher close and the market dropped through the 2/24 reaction line and fell toward the 3/3 lower reaction line, projected by the later reaction swing. I intend to post a video illustrating the full cycle in the next couple of days. This is just another confirmation that is is best to believe in the method and not second guess.
Hello, this is really interesting. Can you show me additional resources to read more ??
You can read more about using action/reaction to project future turning points and target objectives in my book “Unlocking Wealth, Secret to Market Timing”.
Here is link http://www.tradersnetwork.com/trading-products/education/unlocking-wealth
I have been reading this blog for quite sometime now, and this is my first comment. I would like to tell you that I enjoy reading this blog, and that I love thought provoking articles like this!