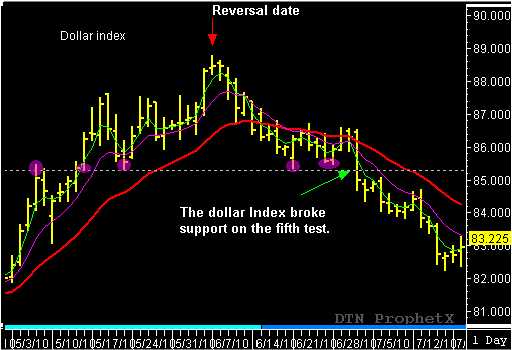
Looking into the past can provide a wealth of information when trying to find future support and resistance levels. Past high or low price pivot points should not be ignored and can be critical when trying to identify or project futures price swings and trend reversals. The later came into play recently in the Dollar Index. The Dollar index had been is a sustained upward trend for several months when it traded up into and peaked on the June 8th reversal date. At first this looked like the same type of corrective pullback the Dollar Index had been experiencing for the past few months as the market began to trad lower off the new pivot high. However, red flags began to appear after the market closed below the 20- day EMA and dropped to a low at 85.36 on June 21. As soon as the Dollar Index traded at 85.36, it bounced back and rallied to a high of 86.71, during the following two sessions. The short-term rally was enough to test the 20-day EMA, before the market reversed and dropped back to test the 85.36 low posted on June 21. The prior low offered enough support for the market to rebound a second time and test the 20-day EMA two more times, before failing and trading lower on July 1.
This is where looking back and reviewing the price history becomes important. Without this historical information a trader wouldn’t know how important the pivot low price at 85.36 has become over time. Looking back to May 6th I can see this level has provided support or resistance six times. This price level provided resistance on May6, followed by support on May 14th, May 12st, June 6th and June 28th. And now, after failing at its attempt to break above the 20-day EMA On June 30th, the Dollar index is poised to test the support for the fifth time.
So, by looking into the past and observing the price action around the 85.36 price level, I can see that this has become a very important price level. If this level is broken, it can suggest a major trend shift and possibly mark the end of the long-term upward trend in the Dollar Index…and it did. The Dollar Index plunged through the support on July 1 and closed 84.98. The market had broken a very important support level and confirmed a major TR swing pattern (Trend Reversal) in the process. The trend shifted from bullish to bearish and continues two trade lower three weeks later.
Swing traders should not ignore the the information privided by this simple technique of looking into the past. The information is critical when using any Swing Trading methodology. By John Crane

