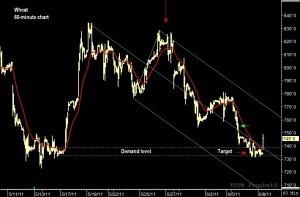
Looking into the past price action can offer some of the best information about future price action. The 60-minute chart of July Wheat offers a great example of this type of trading information. July Wheat traded sharply lower on Monday ans continued lower during Tuesday’s session before turning higher on Wednesday…without warning. However, if you look “inside” the price bar, at the 60-minute chart, Wheat had dropped to a price level that had experience quite a bit a buying a few days earlier. This price action indicates previous strong demand at this level and suggests demand could return. Therefore, we used this demand level as the target objective to cover the short July Wheat position and said we would wait for a corrective rally to offer a second selling opportunity…the market is currently trading 20-cents higher!

