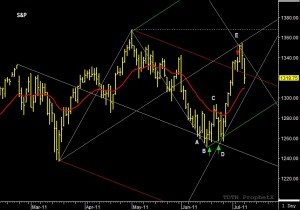
The daily chart of the September S&P offers great example of median lines in action and the benefits of understand price action. Dr. Alan Andrews stated that the market will move towards the latest median line. The median line acts as a target objective where the market should stall or reverse directions. Median line can be a very good swing trading tool on its own, but the addition of projected reversal dates can take you swing trading potential to whole new level.
This chart of the September S&P has two examples of significant reversals at median line. The first reversal occurred around the June 17 and June 23rd reversal dates. The S&P ended the downward trend, on the projected reversal date,and began a substantial rally after bouncing off the downward trending median line.
The second example occurred as the market reached the upward trending median line, one day after the July 6th reversal date, and turned sharply lower. To learn more about using median lines in conjunction with reversal dates please visit www.tradersnetwork.com

