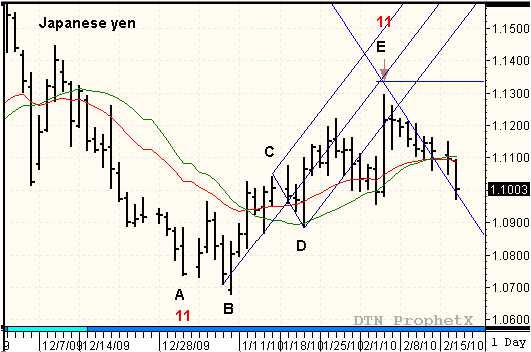
The March Japanese yen has just completed a 5-wave continuation pattern, inside the longer-term downward trend. This type of pattern in a mid-trend pattern and suggests downward trend should continue over the long-term, but right now I want to talk about the 5-wave pattern just completed.
The upward swing began on December 31, after a failed swing pattern formed a new A-B pattern. The Yen rallied off this low and formed a (C) to (D) reaction swing between 1/15 and 1/20, just above the 20- day SMA. This swing pattern was the balancing point of the upward swing (where the action segment ends and the reaction segment begins) and could have been used to pinpoint the time and price of the subsequent price move. This was done with reverse count from 1/15 to the beginning of the cycle (marked as A). The count equaled 11 days. That number was used to make the forward projection of time and price by projecing forward 11 days from 1/20 (marked as D). February 24th was the projected reversal date and the end of the cycle with a initial target objective at the sloping reaction line.
As the February 24th reversal date approached it look dim for the time/price projection as the market drifted lower into February 24th. On the reversal swing day, the market surged to a new high and peaked on the projected date. The short-term corrective swing was complete and the market turned lower, to resume the prevailing trend. The long-term bearish cycle should continue into end of the cycle projected for mid March. I’ll have more on the longer-term downward trend, with time and price projections later.


Terrific article! Keep up the good work!