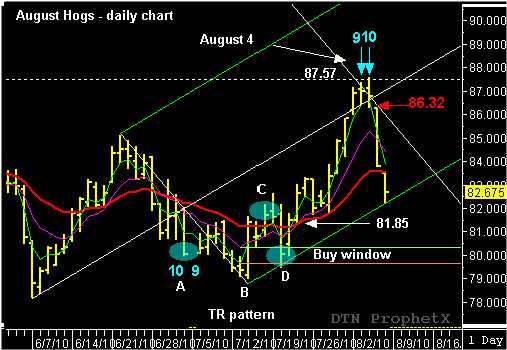
On August 3rd, August Hogs traded at a new three month high, reaching 87.57, before reversing and closing as an “outside day” price bar with a negative close. The next day, the market collapsed and closed limit-down. Could the time and price of this significant high have been predicted? To answer this question, lets take a look at the ‘action/reaction” time and price projections and see what unfolds. The upward trend began with a lower open, followed by a much higher close on July 14th. This date was significant because it marked the end of the five-wave corrective pattern on a previously projected reversal/reaction date. The “outside day” confirmed the pivot low and formed the second pivot of an A -B bottom. (An A-B bottom identifies the first three, out of five pivot points, used to form a TR pattern sequence that I use to confirm major trend reversals.)
The next two pivot points occurred as a high pivot on July 16, called the C pivot, followed by a low pivot on July 20, called the D pivot. The low D pivot occurred inside the 60% buy window and at the lower parallel line support. This price action completed the bullish TR pattern sequence and “setup” a bullish buy trigger price above the high of the signal bar. (The signal bar is the price bar that entered into the 60% buy window…in this example the signal bar occurred on July 20th. The trigger price was 82.20.) The bullish scenario received added confirmation during following day–the trail day–as August Hogs closed higher than the opening price with good separation from the lower ascending parallel line. Now that the pattern is set and the signal pattern confirmed, it is time to use the “action/reaction” theory to make future time and price projections for the upcoming price move.
This process is done with the TR pattern and a reverse/forward count. The reverse count from C to A represents the “action” and equals 9 days to the gap and 10 days to the pivot low. The forward count representing the “reaction” begins at the D pivot low and projects 9 and 10 days forward to identify August 2 and August 3 as a cluster of future reversal/reaction dates. This means August 4 is the “trail day”. (A market that trades higher into the projected reversal/reaction day will typically reverse lower.)
The next step in the process is to use the same reverse/forward count information to draw the action/reaction lines for the price projections. The down-sloping reaction line (price target objective) is anchored where the reaction line intersects the ascending median line and provides a target objective in conjunction with the time projections. In this example the August Hogs reached the reaction line at 87.00, on the August 2 reversal date. Hogs did trade slightly higher on August 3–the second reversal/reaction date–reaching high of 87.37. The final push higher occurred on August 4, when Hogs traded to a new four-month high of 87.57, before closing at 86.80. August 4 was the “trail day” and is considered a directional indicator depending on the direction of the close versus the open…in this case the close was lower, thus indicating lower prices should follow the reversal dates.
It did not take long for the market to respond! Here it is two days later and August Hogs are trading $4.60 lower. August Hogs had began the rally off a reversal/reaction day and bullish TR pattern and ended at the confluence of time and price projections made from the information derived from that TR pattern price action. You can judge for yourself type of information would help you as a trader.
To learn more about how to use “action/reaction” to enhance any swing trading strategy you can read “Unlocking Wealth, Secret to Market Timing” . Go to www.tradersnetwork.com and sign up for a free 30-day trial subscription to the TMV Swing Trading Report.

