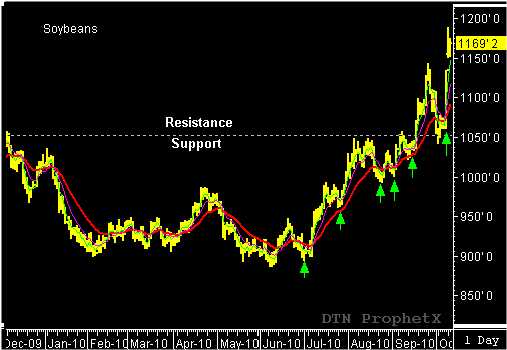
Past market action can offer invaluable information about future market reactions. Simply by looking into the past you can identify key support and resistance levels that may have a profound affect the next price movement of the market. Just recently, November Soybeans offered a very good example of past price action affecting the futures price reaction.
November Soybeans ended a strong upward market swing with a pivot high at $10.49, on August 5th. From this point Soybeans began to trade in a sideways consolidation pattern. During the next four weeks, Soybeans tested the $10.49 price level three more times before finally breaking through on September 17th. Soybeans quickly traded to a high of $11.44 on September 17. From this new high pivot, Soybeans experienced a sharp correction and dropped back to $10.42 and closed at $10.52 on October 4th. This low price provided support as market traded as traders waited for the October 8th USDA Crop Production and Supply and Demand reports to be released. (Coincidentally, both the USDA reports were released on October 8th, also a projected reversal/reaction day.) The reports were deemed as very bullish and Soybeans responded by opening sharply higher and continuing to climb the following session, gaining over a $1.20 in two trading sessions!
Now, let’s go back and look at the beginning of this price move and see how looking into the past played an important role in the future price move. After the market had peaked on September 27th it began to trade lower. Since the market is still in an upward trend, a trader should be looking for the best price level to buy the pullback. Previously, I mentioned the resistance at $10.49, from the swing highs posted on August 8, August 16 and September 7. As soon as the market broke through the resistance it became support and was tested when the market pullback and posted the low on October 4th. However, just how important was this support? This can be determined by looking further into the past. By looking further back in time you can see that this was a critical support level as far back as December 2009.
Understanding how to use past price action to identify future price reaction can provide invaluable information when looking for the best location for a market entry or exit. Combining the critical support with the reversal/reaction dates proved to be a powerful signal leading to the explosive price move. You should know the history of any market before you enter a trade.
To learn more about “action/reaction” trading strategies visit my website at www.tradersnetwork.com

