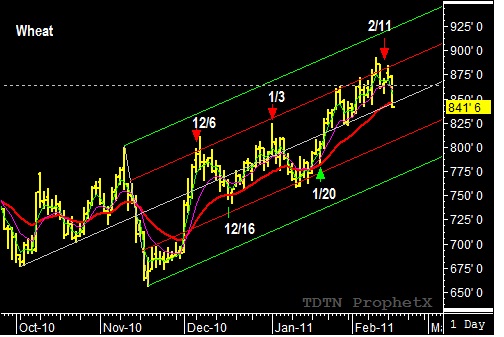
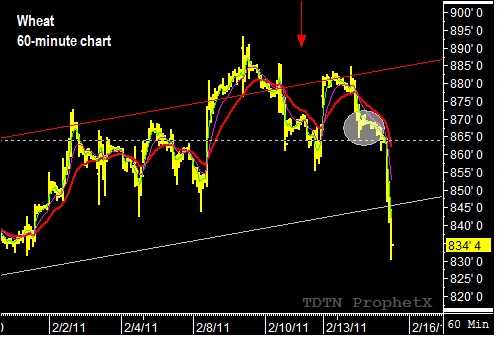
Had a question today, about my early entry signal to sell March Wheat. In yesterday’s issue of the TMV Swing Trading Report I recommended selling the March Wheat at $8.67 instead of waiting for a trade below the prior pivot low of $8.55 1/2 . Wheat had posted a low on the February 11th reversal date, before trading higher on Monday, February 14th. However, the market failed to sustain the rally and drifted lower into the close. The 1st thing that caught my attention with the market had peaked inside the 60% sell window, suggesting the sell trigger price could be moved to just below the low of the price bar that traded into the 60% window. However, I decided to look for further confirmation and looked “inside the bar”. To do this, I dropped down to the 60-minute price chart and looked at the price action.

The 60-minute chart show a bearish peg-leg pattern at the top of Monday’s session upward swing, followed by a small reaction swing–inside a larger-reaction swing–on support. This price formation typically precedes an explosive price move. Both patterns suggested the market was ready to fall and identified $8.67 as the trigger price. The market is currently trading at $8.34…a drop of over 30-cents in just a few hours of trading.

