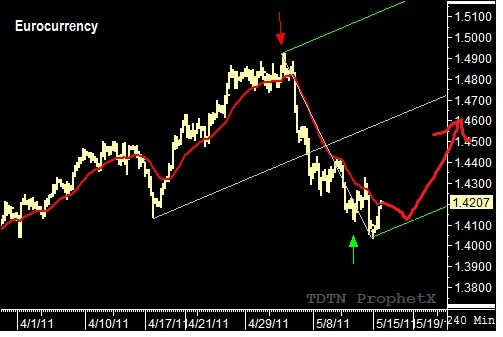
June Eurocurrency – The daily charts shows the market has tested and rallied off the lower parallel line and could be setting up for a new bullish swing trading opportunity. The parallel line represents a long-term support and could prove to be significant over the next few weeks. Adding to the potential bullish price action, is the May 12, 2011 reversal date (represented by the green arrow ), that suggests the market tested the support line in conjunction with reversal cycle timing. Dropping down to the 240-minute chart, I see an A-B bottom formation that could set up a bullish TR pattern sequence that would confirm a trend shift. I will wait for a retest of the lower parallel line, of the newly formed PF (basis the 60-minute chart), to provide a lower risk entry point for a new long position. If the next test of the parallel line on the 240-minute chart holds, I will use the action-reaction method to make a new recommendation in the TMV Swing Trade report.

