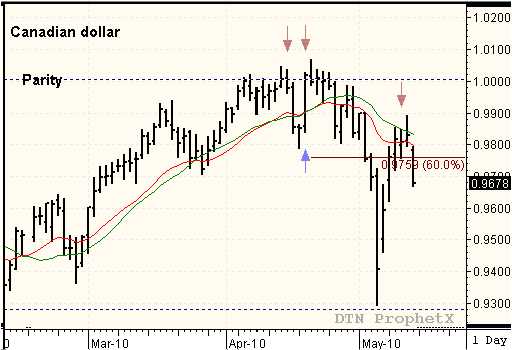
The Canadian dollar formed a bearish TR swing pattern after posting a major high on the April 22nd reversal date and turned lower in front of the May 6th meltdown and subsequent drop to 9293. The “loonie” rebounded from the low and traded higher into the May 12th reversal swing date, closed inside the 60% sell window and tested the 20- day SMA. This price action formed a potential bearish TC pattern with trigger price below the price bar that entered the 60% sell window and triggered the sell when the market passed through .9717. This is just one example of the potential provided by understanding “action-reaction” price action in conjunction with the reversal date trading technique. Using the “action-reaction” time/price projection methodology I was able to identify a major reversal timing on April 22, followed by the high of the corrective rebound on May 12…days in advance.

