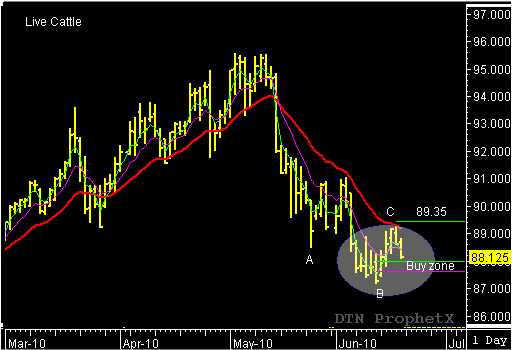
There are a couple of potential swing trade signals showing up on the charts. The first one to look at is in the August Cattle. The market has formed a bullish TR swing pattern after completing an A-B bottom formation on June 11th. The market rallied off this low and reached the 20-day EMA where it formed a (C) pivot high, before pulling back toward the 60% buy window. A trade above the (C) pivot high (89.30) would confirm the bullish TR pattern and trigger the buy signal. I will have the time and price target objectives posted in the TMV Swing Trade report if the signal is confirmed.

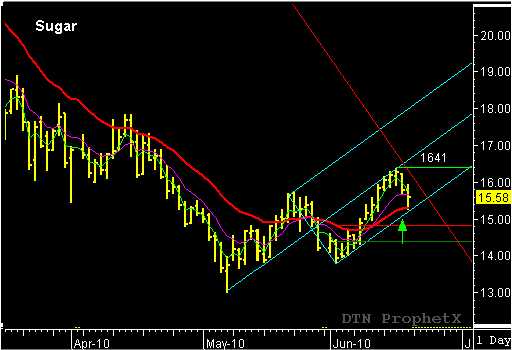
The second pattern is a bullish TC (trend continuation) pattern in the July Sugar. The market began the two-day pullback after testing the reaction line on June 9…one day before the projected reversal date. The market has dropped to the 20-day EMA and up-sloping parallel line. This area should provide support and allow the market to resume the current upward trend. A trade above 16.38 will confirm the bullish TC pattern and trigger the buy signal. I will have any updates in the next issue of the TMV Swing Trade report.

