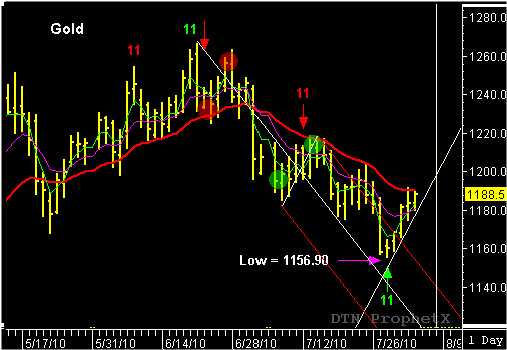
Gold completed the long-term bearish reaction cycle when it reached the downside target objecitve of $1156.90 on the July 28 reversal date. This date had been projected 7 days earlier, after Gold had completed the TC (trend continuation) pattern with a lower close on July 16. Using the newly confirmed TC pattern, a reverse/forward count was done with the results showing the count to be 11 days. This number was used to make the forward projection of July 28 as the next reversal date and the end of the cycle.
After posting the low of July 28, Gold has been trading higher, along the upward sloping reaction line, as it moves toward the next reversal date due on August 6. Also worth noting, is the price movement away for the descending median line as the market dropped into July 28. This is indication of strengthening market and could signal the beginning of a possible shift in the trend. Currently, Gold has stalled at the 20- day EMA and could be setting up for a pullback into the August 6 reversal date. This would form the bullish TR pattern needed to confirm the trend shift. For now, Gold is worth putting on you radar to see if the signals patterns unfold and offer a new signal. I will monitor the Gold and have any new recommendation in the TMV Swing Trade Report.
John Crane

