If you have read any of my books or are a frequent reader of my newsletter and blogs you have probably seen me talk about a 3-wave or 5-wave continuation pattern. When identified correctly, this can be used to project price the time , price and duration of a future price move. The pattern will typically form before and after a significant price move and represents a time where the market will rest and build energy for the next price move.
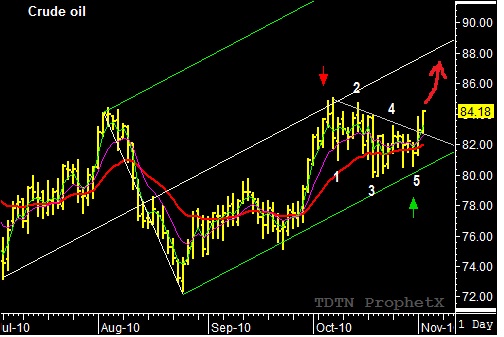
A 5-wave continuation pattern has formed on the December Crude oil chart over the past two weeks. December Crude posted a low pivot at 75.10 on September 23rd and rallied into the October 6th reversal date. The market peaked at 85.08 on October 7 (the “trail day”) before turning lower. The market continued to trade sideways, to lower, until it reached the October 29th reversal date. During this time period the market also formed five pivot points to complete a 5-wave continuation pattern with a small bullish TR pattern culminating on the October 29th reversal dates.
A buy signal was triggered when December Crude oil traded above the prior swing high to confirm the reaction swing and confirm the TR pattern. Reverse/forward count suggests crude oil should advance into November 16 with a target objective of 90.00.

