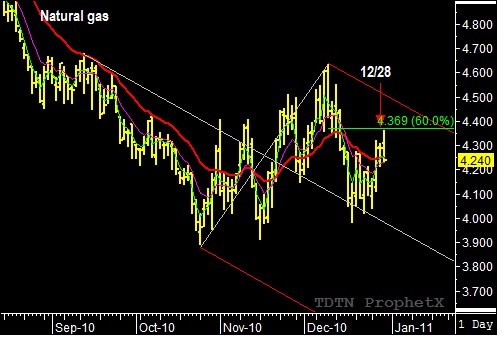
February Natural gas has been trading higher, after bouncing off the descending median line. The eight-day rally advanced Natural gas into the December 28th reversal date, setting up a potential bearish reaction swing. However, the December 28th reversal date failed to trade above the prior high–needed to set up the sell pattern. The following day–Thursday, December 29th–did trade above the reversal day high and test the 60% sell zone at 4.364. This could be was enough to complete the signal pattern for a reversal day sell signal at 4.112. A trade below the 4.112 trigger price portends another test of the descending median line with potential to continue beyond. On the other hand, a close above the opening price would suggest a continuation of the corrective rebound and a possible test of the upper parallel line. I will have updated information in the next issues of the TMV Swing Trading Report . To learn more go to www.tradersnetwork.com

