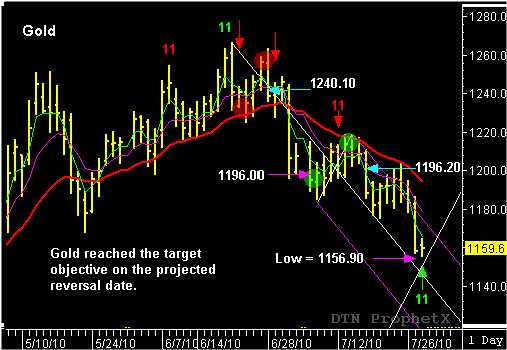
As the August Gold futures contract trades at a new twelve week low and tests the reaction line target objective (currently at $1155.90) on a projected reversal date, I think it would be a good time to look back and see how this reversal date and target objective were determined, several days in advance. To begin, I will go back to June 25th, when August Gold rallied closed at $1256.20. This high close was a failed attempt to retest the previous high close of $1258.30, posted on June 18th. The following trading day–June 28th–Gold rallied early but failed to find new buyers, quickly lost momentum and dropped below the prior day’s low. This price action took place inside the major sell window and confirmed the final pivot of the TR pattern (Trend Reversal) sequence. This pattern typically appears at major turning points and can signal a major trend shift. In this case, it signaled an end to the upward trend and the beginning of a new downward price swing. As soon as the TR pattern (marked in red) was confirmed, a reverse-forward count was used to make the time projection for the future reversal/ reaction date. The information derived from the reverse-forward count was used to project forward identify July 12th as the next potential reversal/reaction date. The same time projection was then used to make a future price projection at a target objective at $1197.00. So, that means the information provided by the past price action between June 8th and June 28th was used to project a new downward swing to $1196.oo and projects the market should reach this target objective on or before the July 12threversal/reaction date.
Gold traded through $1196.00 on July 9th, right before a four-day corrective rally into the July 12th reversal date. The higher trade, into the July 12th reversal date, is a bearish “setup” pattern and helps set up a new selling opportunity, after a signal pattern confirmation.
The new sell pattern was confirmed on July 16th, after Gold tested the 20-day EMA on July 13th, the day after the projected reversal date) and dropped out of the bottom of the reaction swing formation and traded below the July 13th low of $1196.50. The new reaction swing (July 6th to July13th, marked in green) was then used for a new reverse-forward count for a new set of time and price projections to identify the next price target objective and future reversal/reaction date. This new information was used to project a new reaction line target objective at $1151.00 and a future reversal/reaction date for July 28th…the market reached a new twelve week low of $1155.60 on the predicted reversal date of July 28th!
Two things are important to note with this sequence of trade signals. In both trade signals, the market either reached the target objective or ran out of time before reaching the projected target price. Either way, the trader is aware of where that market is and where it should be going, so they can take proper action. For example, the first trade signal (sell at $1258.30) reached the $1196.00.00 price target objective, before the predicted reversal date, so price was ahead of time. The market adjusted during the second trade signal (sell at $1196.50) and only traded to a low of $11.55.60 on the July 27th reversal date. ( At the time I am writing this blog) This trade signal ended with the market running out of time before reaching the target objective, however, I think most traders would be happy with the results from both swing trading signals.
The swing tradings signals just illustrated with identified with using the “action-reaction” theory and combined with John Crane’s reversal date indicator. To learn more about this swing trading methodology go to www.tradersnetwork.com.

