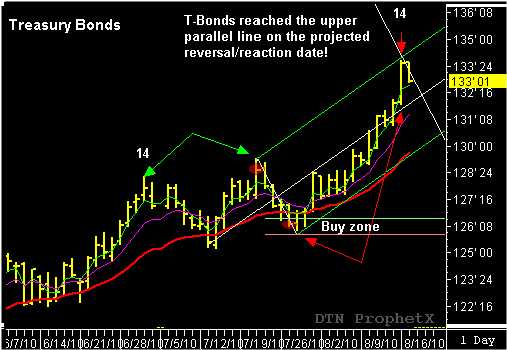
September Treasury bonds reached the target objective at 134-00, on the projected reversal/reaction date. In a classic “action-reaction’ fashion, the market reached the projected price level on the predicted reversal/reaction date.
This is a good time to take a look back to see how the target objective and reversal/reaction date could have been identified two weeks earlier. The key to this swing trading timing strategy was the reaction swing that formed between July 21 and July 27. Initially, I was looking at this as a possible bearish TR swing pattern following the swing pattern failure after the new high on July 21. The market failed to continue to trade higher after the breakout lower over the next few days before forming a swing pivot low inside the 60% buy window. The low pivot wasconfirmed by a higher close on July 30.
Once the pivot low was confirmed, the reaction swing became a TC (trend continuation) pattern. The reverse/forward count from July 21, back to the prior swing high, resulted in a count of 14 days. The forward count of 14 days, from the July 27 low, projected a future reversal/reaction date for August 16. This was the time projection for the cycle.
The next step was finding the price target objective using the “action-reaction” lines. The “action” line is drawn from the high of the reaction swing to the low of the reaction swing. The “reaction” line is drawn parallel to the action line and placed where the upper parallel line intersects the projected reversal/reaction date…134-00. September Treasury bonds traded at 134-01 on August 16!
All these time and price projections could have been made after July 30, when the market traded above the 127-10 to confirmed the low pivot that completed the reaction swing.
See more trade signals like this at www.tradersnetwork.com.
John Crane

