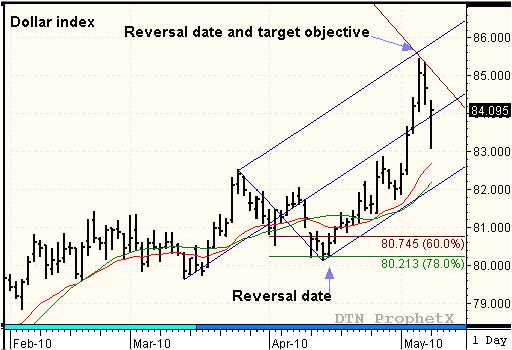
During last Thursday’s trading session the business channels were full experts expressing shock as the market plunged. They acted surprised that the market could be trading lower in the mist of such a strong and prolonged upward trend. But, was it really a surprise and were there warning signs that preceded the unprecedented price collapse? I think so. In early April I began talking about the 11284 target objective for the Dow Jones futures. This level represents the .618 Fib retracement of the price move that began at the October 8, 2007 high to the March 2, 2009 low. The 11284 target objective also fell in line with the “action-reaction” time price projections and the April 27th reversal date. The Dow Jones came up 78 points short of reaching the 11284 target objective when it peaked at 11206 on April 26. However, the market did reverse on the April 27th reversal swing date dropped down to the ascending median line before staging a two-day corrective rally into the down-sloping reaction line resistance. This price action completed the TR pattern sequence and subsequent trend shift. The trend shift was completed after the market traded out of the 60% sell window and below the prior swing low on May 4th. The rest is history as the continued lower and went on to post the largest one-day point drop in history when the Dow Jones futures plunged to 9840 two days later. The “action-reaction” TR pattern with stood the test and signaled the trend shift warned of the drive decline in advance. Typical market reaction suggest the market may rebound into the 60% sell window and possibly test 10850 before resuming the new downward trend. I will stand aside and wait for a new confirmation pattern before making any new recommendations in the Traders Market View Swing Trading Report.
×
Comments are closed.

