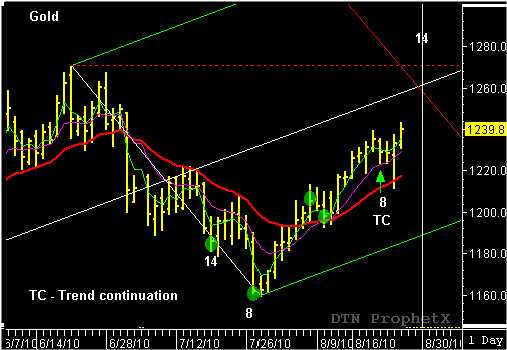
A five-wave corrective pattern came to an end and a new upward reaction cycle began, after Gold confirmed a pivot low on July 27. However, it was not until after the TC (trend continuation) swing pattern that formed between August 6 and August 10, that the bullish TR pattern sequence was confirmed and new time and price projections could be made. The two-day pullback was stopped on August 10, by support from the 20- day EMA. Gold turned higher off this pivot low and confirm a bullish TC pattern on August 12th. As soon as the TC pattern and trend direction was confirmed with the break above $1210.00 , a reverse/forward count was used to project future reversal/reaction dates for August 20 and August 30.
As projected, Gold continued to trade higher until it reached $1239.50 where it began a two-day pullback that ended with a lower close on the August 20th reversal date. The low close on the projected reversal/reaction date is considered a continuation pattern and suggest Gold is poised for another bullish leg in the cycle. That is exactly what happens as Gold trades above the prior high ($1239.50) and resumes the upward trend into the major reversal/reaction date due on August 30 with a possible target objective between $1260.00 and $1270.00.
For updates on Gold and other market signals using “action-reaction” and the reversal date indicator go to www.tradersnetwork.com and sign up for a free 30 -day trial subscription to the Traders Market Views Daily Swing Trading report.
John Crane

