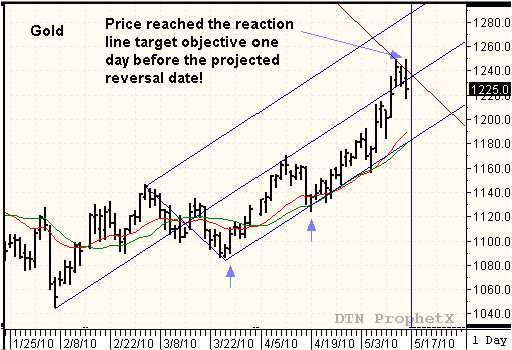
This chart offers a good example of a TC pattern (Trend Continuation) in the June Gold. After touched the ascending median line on April 12th, Gold began a corrective pull back into the April 19th reversal date and posted a low at $1124.50, where Gold found support from the up-sloping lower parallel line and the 20- day SMA. The reversal date confirmed the low pivot and the beginnng of a new upward leg. The price swing between April 14 and April 19 formed the TC pattern and could also be used to make the future time and price porjection that identified May 17th as the future reversal date and put the reaction line target objective at the $1250.00 price level. Gold continued the rally off the April 19th reversal date and reached a high of $1249.70 on Friday, April 14, one day before the date, projected three weeks earlier. To learn more about this type of swing trading strategies using the “action-reaction” method with reversal dates you can read “Unlocking Wealth, Secret to Market Timing.

