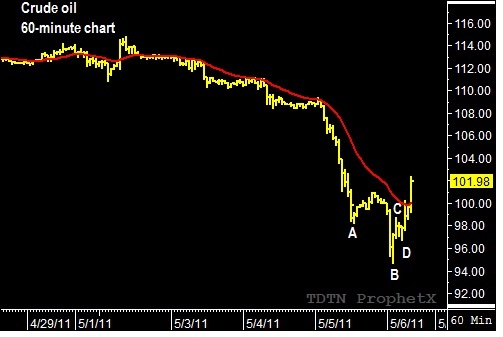
Bullish A-B pattern has formed on the 60-minute Crude oil chart. This price pattern marks the beginning of a bullish TR pattern and triggered a buy for the June Crude oil. The reverse/forward counts suggests the corrective rebound could continue into Sunday evening.

