The recent price action in the July Natural gas offers a good example of the “action-reaction” trading methodology is action. Knowing probable levels of future support and resistance levels has always been a goal of both swing traders and day traders alike. The advance knowledge can give you an edge when looking to lower your risk when entering a trade and keep more of your profits at the exit. Of the two, the exit has always proved to be the more difficult for the trader to time correctly. Early in my trading career, I was told that anyone can get into the market, but it is the exit that will usually determine the amount of success or failure of the trade.
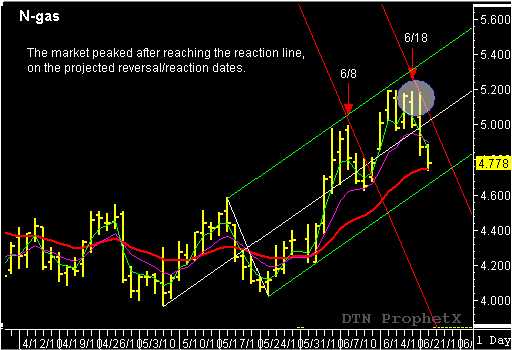
That brings me back to what I call “Market Timing Intelligence”. Instead of a long explanation, I will just show a good example of swing trading with Market Timing Intelligence in action. Look at the chart of July N-gas. The market completed a bullish Trend Reversal (TR-pattern) after posting a pivot low inside the 60% buy zone on May 24th. This is where “Market Timing Intelligence” can play an important role in any swing trading strategy. As soon as the low pivot was confirmed, the reverse/forward count was completed back to the pivot low on April 30. The reverse count was 11 days and could be used to project a potential future reversal/reaction day for June 8th. The same information was used to draw the down-sloping reaction line (red line) and place it where the up-sloping median line (white center line) intersects with the June 8th reversal date. The reaction line works as a price target objective.
N-gas staged a strong rally off the May 24th low (4049) and traded to a high of 4.995 on the June 8th reversal date. This price was also near the target objective identified by the reaction line target objective. N-gas gas reversed on June 8th and traded lower for the next two days. This price action formed a new Trend Continuation (TC) pattern and set up the next swing trading opportunity and swing pattern for the next time and price projection. Once again, the reverse/forward count comes into play after the swing low has been confirmed. The reverse count, back to the prior swing high, equals 6 days and can be used to project forward and identify June 18th as the next potential reversal/reaction day. The market does continue the upward trend, off the June 10th swing low and peaks at 5.194 on June 15. From that point on the market moves into a sideways pattern and trades to a high of 5.190 on the June 18th reversal date, where it also tests the down-sloping reaction line, bringing time and price together. The following day saw the market reverse and drop sharply over the next two days.
There were two swing trading opportunities during the three-week rally in the N-gas. Both times, the “action-reaction” could have been used to project the timing and price objectives of the future price swings. This is what I refer to Swing Trading with “Market Timing Intelligence.” This trading technique is simple to learn and easy to implement. Plus, it can be added to any trading strategy; therefore, a trader does not have to abandon their favorite strategy. This is the type of trade signals I look for everyday and post in the Traders Market Views Swing Trade report.

