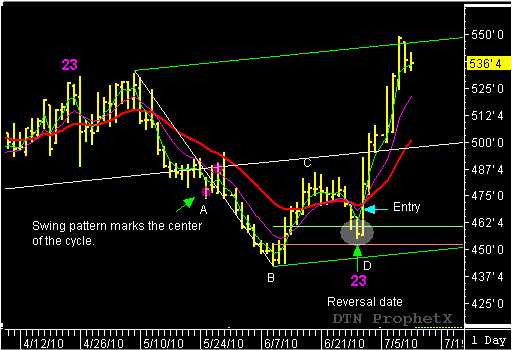
– A look at the recent chart of the September Wheat shows a very good example of “action/reaction” combined with a reversal date projection. Combining the two unique trading techniques can be a very powerful swing trading strategy. The first thing I want you to notice is the June 29th reversal date, marked as the (D) pivot low and highlighted inside the gray circle. This potential reversal date could have been predetermined, four weeks earlier, by using the May 25th -May 27th reaction swing with a reverse count back to the high close on April 22nd. The count of 23 days could then be used in the forward count to project June 29th as a future reversal date. However, a potential reversal date swing trading signal has to be confirmed by the proper signal pattern and price action before it can be considered a valid reversal date swing trading signal.
The signal confirmation came after the Wheat traded lower–down from the (C) pivot high–and closed inside the 60% buy window (below $4.59) on the June 29th reversal date that was predicted earlier. This price action set up the potential reversal signal. The buy signal was confirmed the following day, when September Wheat traded above the June 29th high ($4.64 3/4) and closed higher on the day. Wheat rallied over $.80 cents during the next seven trading sessions and stopped only after it reached the upper parallel line.
Although this is great example of time and price working together, a trader must know how the two work together in order to take advantage of these types of trade examples.
I will have further updates on swing trading strategies for the wheat and other markets in the blog. Make sure you mark it in you favorites so you would miss the next one.
John Crane

