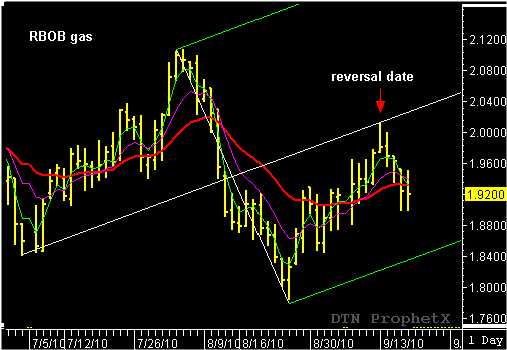
According to Dr. Alan Andrews, one of the main median line trading principles was that price will return to the median line 80% of the time. Secondly, if the price trades up to the median line and gaps down or makes a long-range day away for the median line, it is a sell signal. Understanding these two principles of market behavior can give a swing trader the edge when determining entry and exits.
While these two price action principles can provide the edge, I like to take it one step further with the Reversal Date Indicatior. I find the reversal timing , combined with median line, can enhance the time and price projections. October RBOB gasoline provides a good example of the strategy.
October RBOB gasoline began the new upward trend on the August 25th reversal date. The upward trend was confirmed by a second reversal date on August 31. I was able to use this price action to project September 13th as the next reversal date. The chart shows the market reaching the median line on September 13… the reversal date projected a week earlier. RBOB gas peaked at 2.0131 before falling back to close at 1.9806…a difference of $1,365. Knowing in advance where price would intersect the median line and the probability of a price reversal would have allowed the alert trader to exit the swing trade near the daily high, turning a good trade into a great trade.

