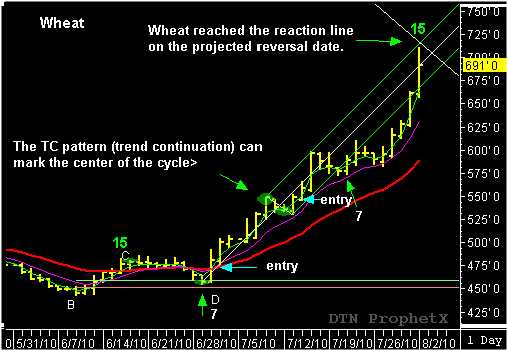
On June 29, September Wheat traded lower and closed at $4.57. This close was inside the 60% buy window that had began at $4.58 1/2. The following day, Wheat opened steady before surging higher and closing above the previous three closes. This higher close confirmed the June 29 low as the (D) pivot low. At the same time, the higher close completed the bullish TR (trend reversal) pattern sequence and marked the beginning of a new upward trend.
Since the market had dipped into the 60% buy window, the trigger price, for the buy signal, was dropped from above the (C) pivot high, down to the high of the signal bar, plus 2 cents. (The signal bar is theprice bar that traded into 60% buy window. In this example the high was $4.64 3/4, plus 2 cents makes the trigger price for the buy signal $4.66 3/4.)
The initial time and price projections were made from the reverse/forward count using the TR pattern sequence. The reverse count from the (C) pivot high(June 17) back to the (A) pivot low (May 25) equaled 17 days. The forward count projected a future reversal/reaction date for July 22 and a price objective of $5.80. The target objective was reached early, as the Wheat market surpassed the $5.80 price level and closed at $5.98 1/2 on July 15. The next day, Wheat began to trade lower and traded in a sideways consolidation pattern into July 22.
However, a new TC (trend continuation) pattern had formed between July 8 and July 12. The TC pattern will typically mark the center of a new reaction cycle and can also be used to make time and price projections. The reverse/forward count from the beginning of the new TC pattern (July 8), back to the (C) pivot high (June 17, the beginning for the TC pattern sequence) equaled 15 days. The forward count of 15 days, projected Monday, August 2 as the next reversal/reaction date with a target objective at $7.00. Wheat traded at a new high of $7.11 1/4 on Monday, August 2!
Is this the end of the Wheat move? That is yet to be seen, but the time and price projections of previous price moves where accuately projected using the “action-reaction” theory in combination with the reversal date indicator. To learn more about how the time and price projections were determined using just the price action, check out “Unlocking Wealth, Secret to Market Timing”by John Crane. You can also sign up for a 30-day free trial offer of TMV Swing Trading Report by John Crane by going to www.tradersnetwork.com.

