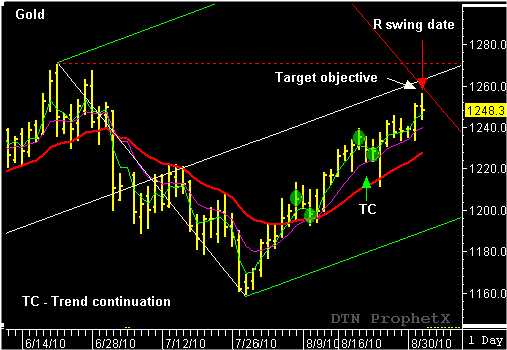
In the August 25th issue of the Traders Market Views Swing Trading report, I wrote about the bullish TC pattern (trend continuation) that had just formed in the December Gold. The TC pattern began with the high pivot on August 19 and ended with a low pivot on August 23…which also happened to be a projected reversal date. The following day, August 24th, opened steady before falling to the 20- day EMA at $1211.70. The EMA provided support for a sharp rebound and a close above the prior day’s high. This was considered a bullish “trail day” close and a confirmation of the bullish TC pattern. Based on this signal pattern, I recommended a buy for the December Gold at $1238.10, with a target objective at $1252.90. The reverse/forward count projected Wednesday, September 1 as the next potential reversal date for the market to reach this price objective. Gold traded to a high of $1256.60 on Wednesday, September 1…reaching the target objective and closing the recommended long position. Right on time!
For more information about how you can learn to you the “action-reaction” swing trading strategy for you own trading check out www.tradersnetwork.com or read my book “Unlocking Wealth – Secret to Market Timing.” John Crane

