Why does your trading system over-promise and under-deliver?
 Are you on a search for the Holy Grail? It Doesn’t Exist!
Is it time to trade a program designed for all market conditions, including tomorrow’s markets?
Sign Up For A Trial
Sign Up For A Trial
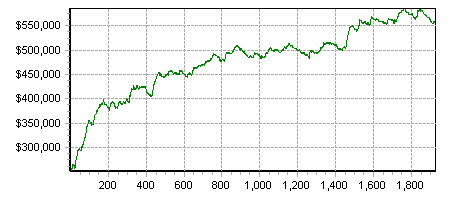
(*Total Profit includes both open and closed positions. Simulating 1 contract for each trade with allowance for $45.00 commission and no slippage.) Trades From Apr 28, 2009 to Apr 30 2010
This page shows the current simulated historical performance of the Systematic Swing Trader trading system. You can choose a contract and period of time or choose “All” to view the combined performance of all contracts that the Systematic Swing Trader follows. CFTC RULE 4.41 – HYPOTHETICAL OR SIMULATED PERFORMANCE RESULTS HAVE CERTAIN LIMITATIONS. UNLIKE AN ACTUAL PERFORMANCE RECORD, SIMULATED RESULTS DO NOT REPRESENT ACTUAL TRADING. ALSO, SINCE THE TRADES HAVE NOT BEEN EXECUTED, THE RESULTS MAY HAVE UNDER-OR-OVER COMPENSATED FOR THE IMPACT, IF ANY, OF CERTAIN MARKET FACTORS, SUCH AS LACK OF LIQUIDITY. SIMULATED TRADING PROGRAMS IN GENERAL ARE ALSO SUBJECT TO THE FACT THAT THEY ARE DESIGNED WITH THE BENEFIT OF HINDSIGHT. NO REPRESENTATION IS BEING MADE THAT ANY ACCOUNT WILL OR IS LIKELY TO ACHIEVE PROFIT OR LOSSES SIMILAR TO THOSE SHOWN.
|


