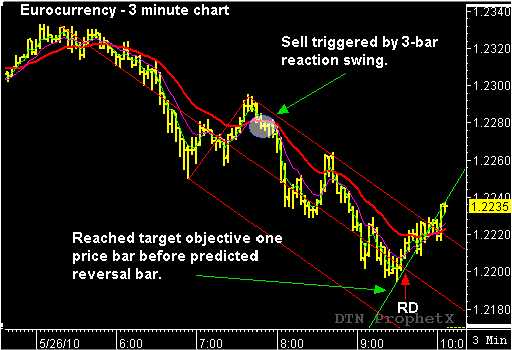
Most of my posts are about swing trading strategies using daily charts. Therefore, I am often asked if the “action-reaction” method can also be used when daytrading. Yes, it can. This 3-minute chart, of the June Eurocurrency, offers a great example of “action-reaction” at work intra-day. Between 7:48 a.m. and 7:54 a.m. (MST) on the morning of May 26, the June euro formed a 3-bar reaction swing following an A-B-C continuation pattern. The 3-bar reaction swing triggered a sell signal at 1.2270. As soon as the sell signal was triggered, I was able to overlay the Andrew’s Pitchfork and do the reverse/forward count to make my time and price projections. The forward count projected the future reversal bar for 9:33 a.m. with a target objective at 1.2202. ( Both time and price projections are marked on the chart with the red arrow marking the reversal bar and the up-sloping green line as the reaction line and target objective.) The euro dropped down to the down-sloping median line before undergoing a short-term 3-bar corrective bounce between 8:30 a.m. and 8;36 a.m. The market remained inside the pitchfork and turned lower after testing the upper parallel line. The euro continued lower until it reached the reaction line (green line) at 9;30 a.m., trading to a low of 1.2195 before turning higher. This low formed one price bar before the predicted 9:33 a.m. reversal bar and proved to be the low of the downward price swing.
The euro chart is good illustration of how the “action-reaction” theory can be used in combination with the market timing intelligence provided by the reversal trading indicator. The methodology is easy to learn and simple to use. The key understand market behavior and being able to identify the two key patterns used to market the time and price projections. The book “Unlocking Wealth – Secret to Market Timing”describes the methodology in detail. You can also check out the blogs and YouTube.com videos on our website www.tradersnetwork.com.

